The Page Speed Issues tab in Risify’s Store Audit measures how fast your store loads for visitors. A slow store frustrates shoppers, increases bounce rates, and hurts your search rankings. Google uses page speed metrics (Core Web Vitals) as a ranking factor, so improving speed can directly improve your visibility.
Risify tests three key pages: your homepage, your top-selling product, and your largest collection. Results are shown for both Mobile and Desktop.
What the Page Speed Tab Shows
Performance Score
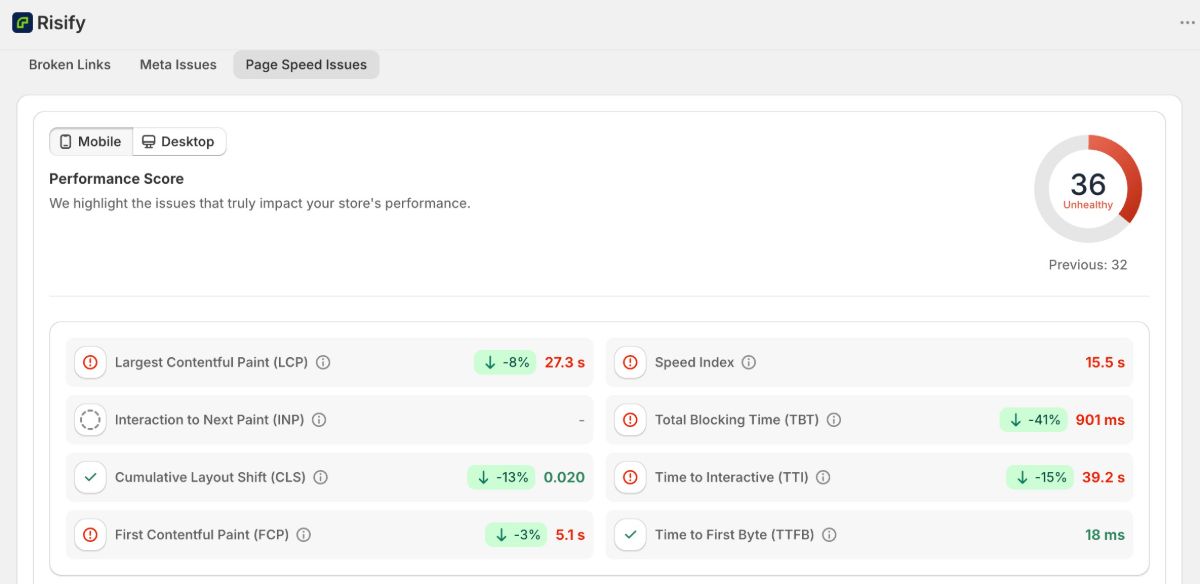
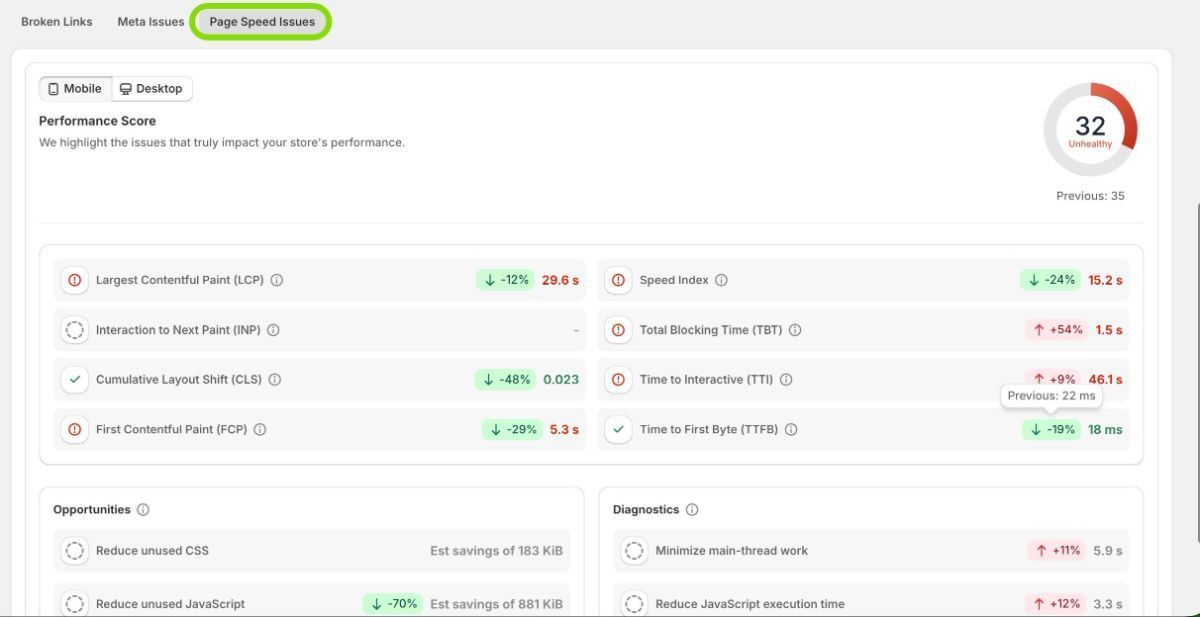
At the top right, you will see a circular score from 0 to 100 with a label like “Unhealthy,” “Needs Improvement,” or “Healthy.” This is your overall performance score. It also shows your previous score so you can track the direction.
You can switch between Mobile and Desktop using the toggle at the top left. Mobile scores are almost always lower than desktop because mobile devices have less processing power and often use slower connections. Since Google uses mobile-first indexing, your mobile score is the one that matters most for rankings.
Core Web Vitals and Supporting Metrics
Below the score, you will see eight performance metrics. Each one shows its current value, the percentage change since your last audit, and a color-coded icon (green for good, orange for needs improvement, red for poor).
Core Web Vitals
- Largest Contentful Paint (LCP): How long it takes for the largest visible element (usually a hero image or main text block) to appear. Target: under 2.5 seconds.
- Cumulative Layout Shift (CLS): How much page elements move unexpectedly during loading. Shifting banners, late-loading images, and font swaps cause high CLS. Target: under 0.1.
- Interaction to Next Paint (INP): How quickly the page responds when a user taps a button or interacts with an element. Target: under 200 milliseconds.
Supporting Metrics
- First Contentful Paint (FCP): Time until the first visible content element appears on screen.
- Speed Index: How quickly content becomes visually complete during loading.
- Total Blocking Time (TBT): Duration during which the page cannot respond to user input because JavaScript is executing.
- Time to Interactive (TTI): When the page becomes fully usable and responsive to input.
- Time to First Byte (TTFB): The time between the browser’s request and the first byte of the server’s response. Indicates server and hosting performance.
Opportunities
The Opportunities section lists specific actions that could reduce your load time. Each suggestion shows the estimated savings. Examples include reducing unused CSS, reducing unused JavaScript, and minifying CSS. These are technical improvements that typically require a developer or a Shopify app to implement.
Diagnostics
The Diagnostics section shows additional technical checks that affect performance. Examples include minimizing main-thread work, reducing JavaScript execution time, and ensuring image elements have explicit width and height attributes. Each diagnostic includes a measurement and percentage change from the previous audit.
How to Interpret the Results
The Performance Score gives you the big picture. The individual metrics tell you where the problems are. The Opportunities and Diagnostics tell you what to do about them.
Here is how to read the color coding:
- Green (with checkmark): This metric is in the healthy range. No action needed.
- Orange (with warning icon): This metric needs improvement. It is not critical but is affecting your score.
- Red (with error icon): This metric is poor and is significantly dragging down your performance. Prioritize fixing it.
The percentage change next to each metric (e.g., “↓ -8%” or “↑ +46%”) shows how that metric changed compared to your previous audit. A downward arrow with a negative percentage means the metric improved (lower is better for load times). An upward arrow means it got worse.
How to Fix Page Speed Issues
Page speed improvements happen outside of Risify. The audit gives you visibility into what is slow and why, but the fixes are made in your Shopify theme, your app stack, and your image files.
The most common fixes, ranked by impact:
- Optimize images: Resize product photos to their actual display dimensions, use WebP format, and compress files before uploading. This addresses LCP and Speed Index.
- Remove unused apps: Uninstall Shopify apps you are not actively using. Each app adds JavaScript that slows loading. This addresses TBT and TTI.
- Reduce third-party scripts: Chat widgets, tracking pixels, and social embeds add external requests. Keep only what you need. This addresses TBT and Speed Index.
- Use a lightweight theme: Modern Online Store 2.0 themes are built for speed. If your theme is old or heavily customized, migration may be the single biggest improvement. This addresses all metrics.
For a complete guide on improving page speed with detailed steps for each fix, see How to Improve Page Speed on Your Shopify Store .
Tips
- Always check mobile first. Mobile performance is what Google uses for ranking.
- Focus on red metrics before orange ones. They have the biggest impact on both your score and your customers’ experience.
- Run a new audit after making speed improvements to measure the impact and confirm the changes worked.
- Page speed is an ongoing effort, not a one-time fix. New apps, theme updates, and content changes can all affect speed over time.